Engineering Selection Methodology for All 10 Thread Release Mechanisms
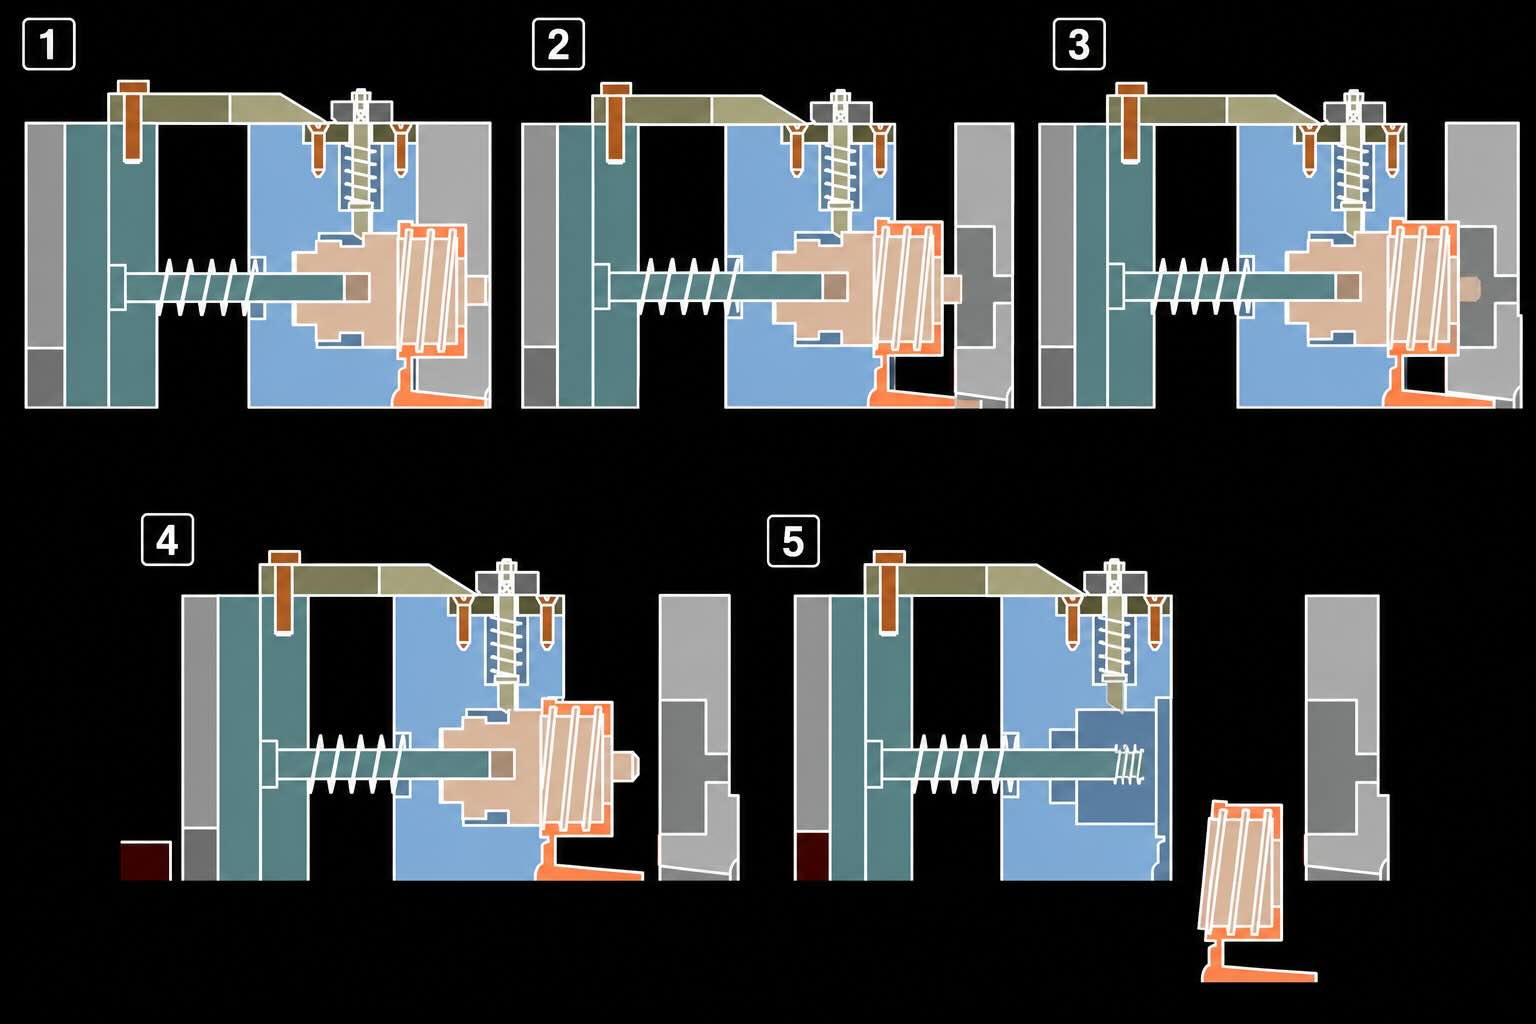
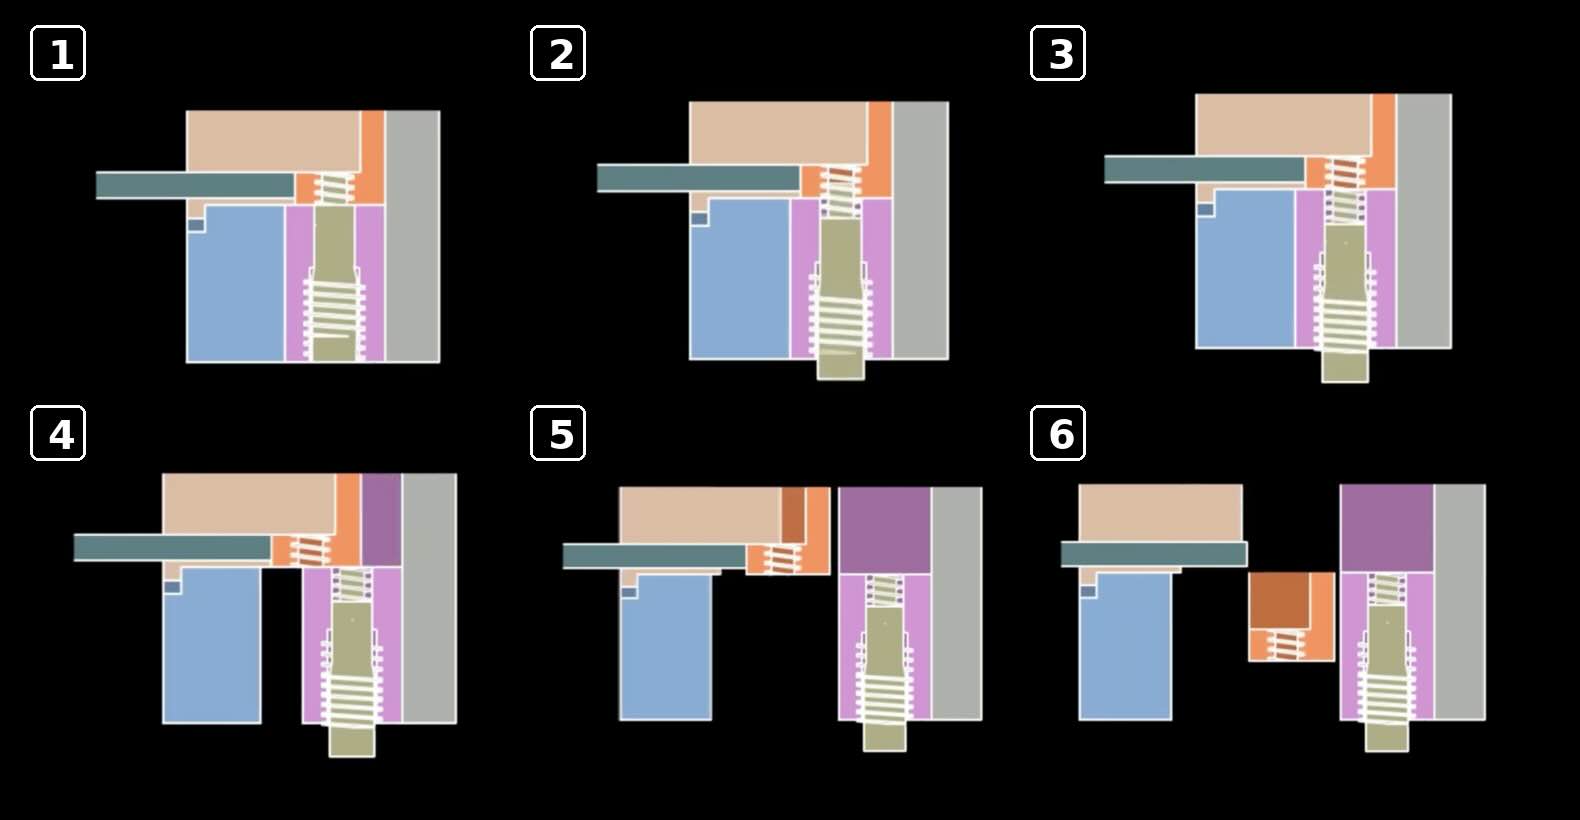
Throughout the previous five pillar articles, we examined ten different thread release mechanisms used in injection mold design.
These mechanisms ranged from simple force stripping solutions to advanced hydraulic unscrewing systems capable of generating extremely high torque.
A common mistake among mold designers is focusing on a favorite mechanism rather than selecting the most appropriate solution for the specific application.
The objective of this final pillar article is to establish a systematic engineering methodology for selecting the optimal thread release system.
This article combines all ten mechanisms into a single decision-making framework.
The Ten Mechanisms Reviewed
The mechanisms covered throughout this series include:
Mechanism 1
Motor Driven Unscrewing System
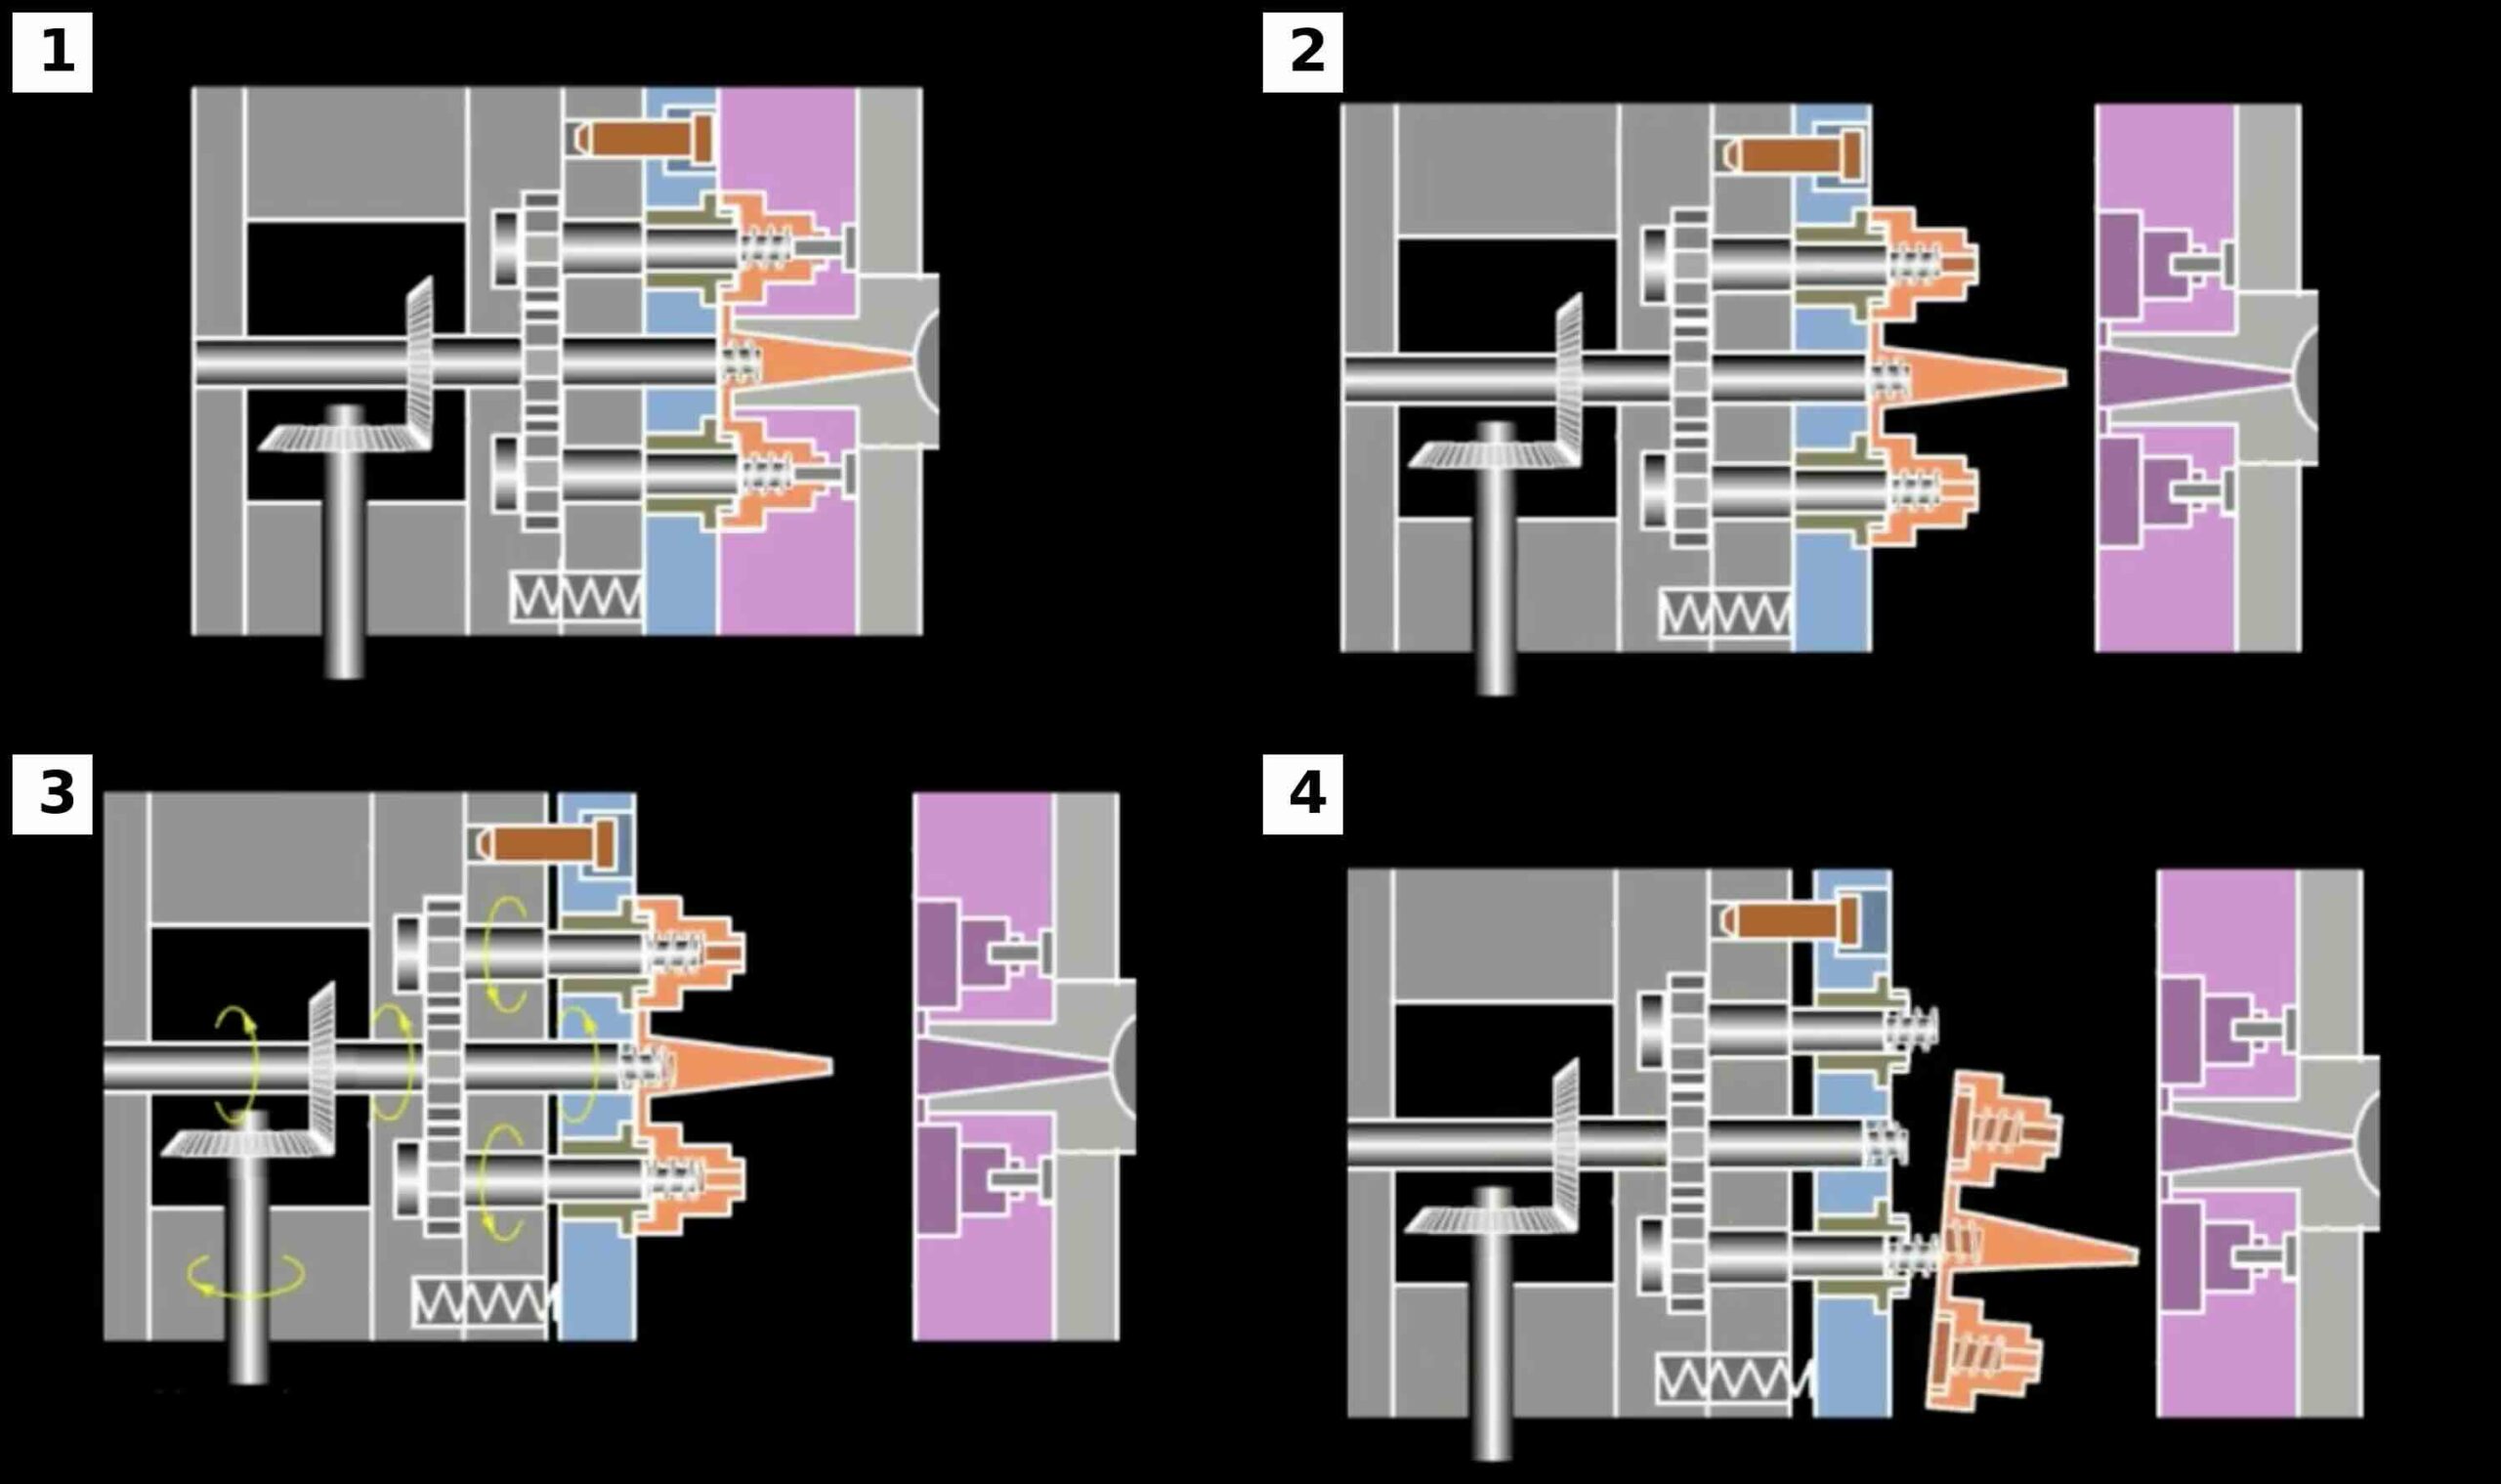
Mechanism 2
Rack and Pinion Unscrewing Type 1
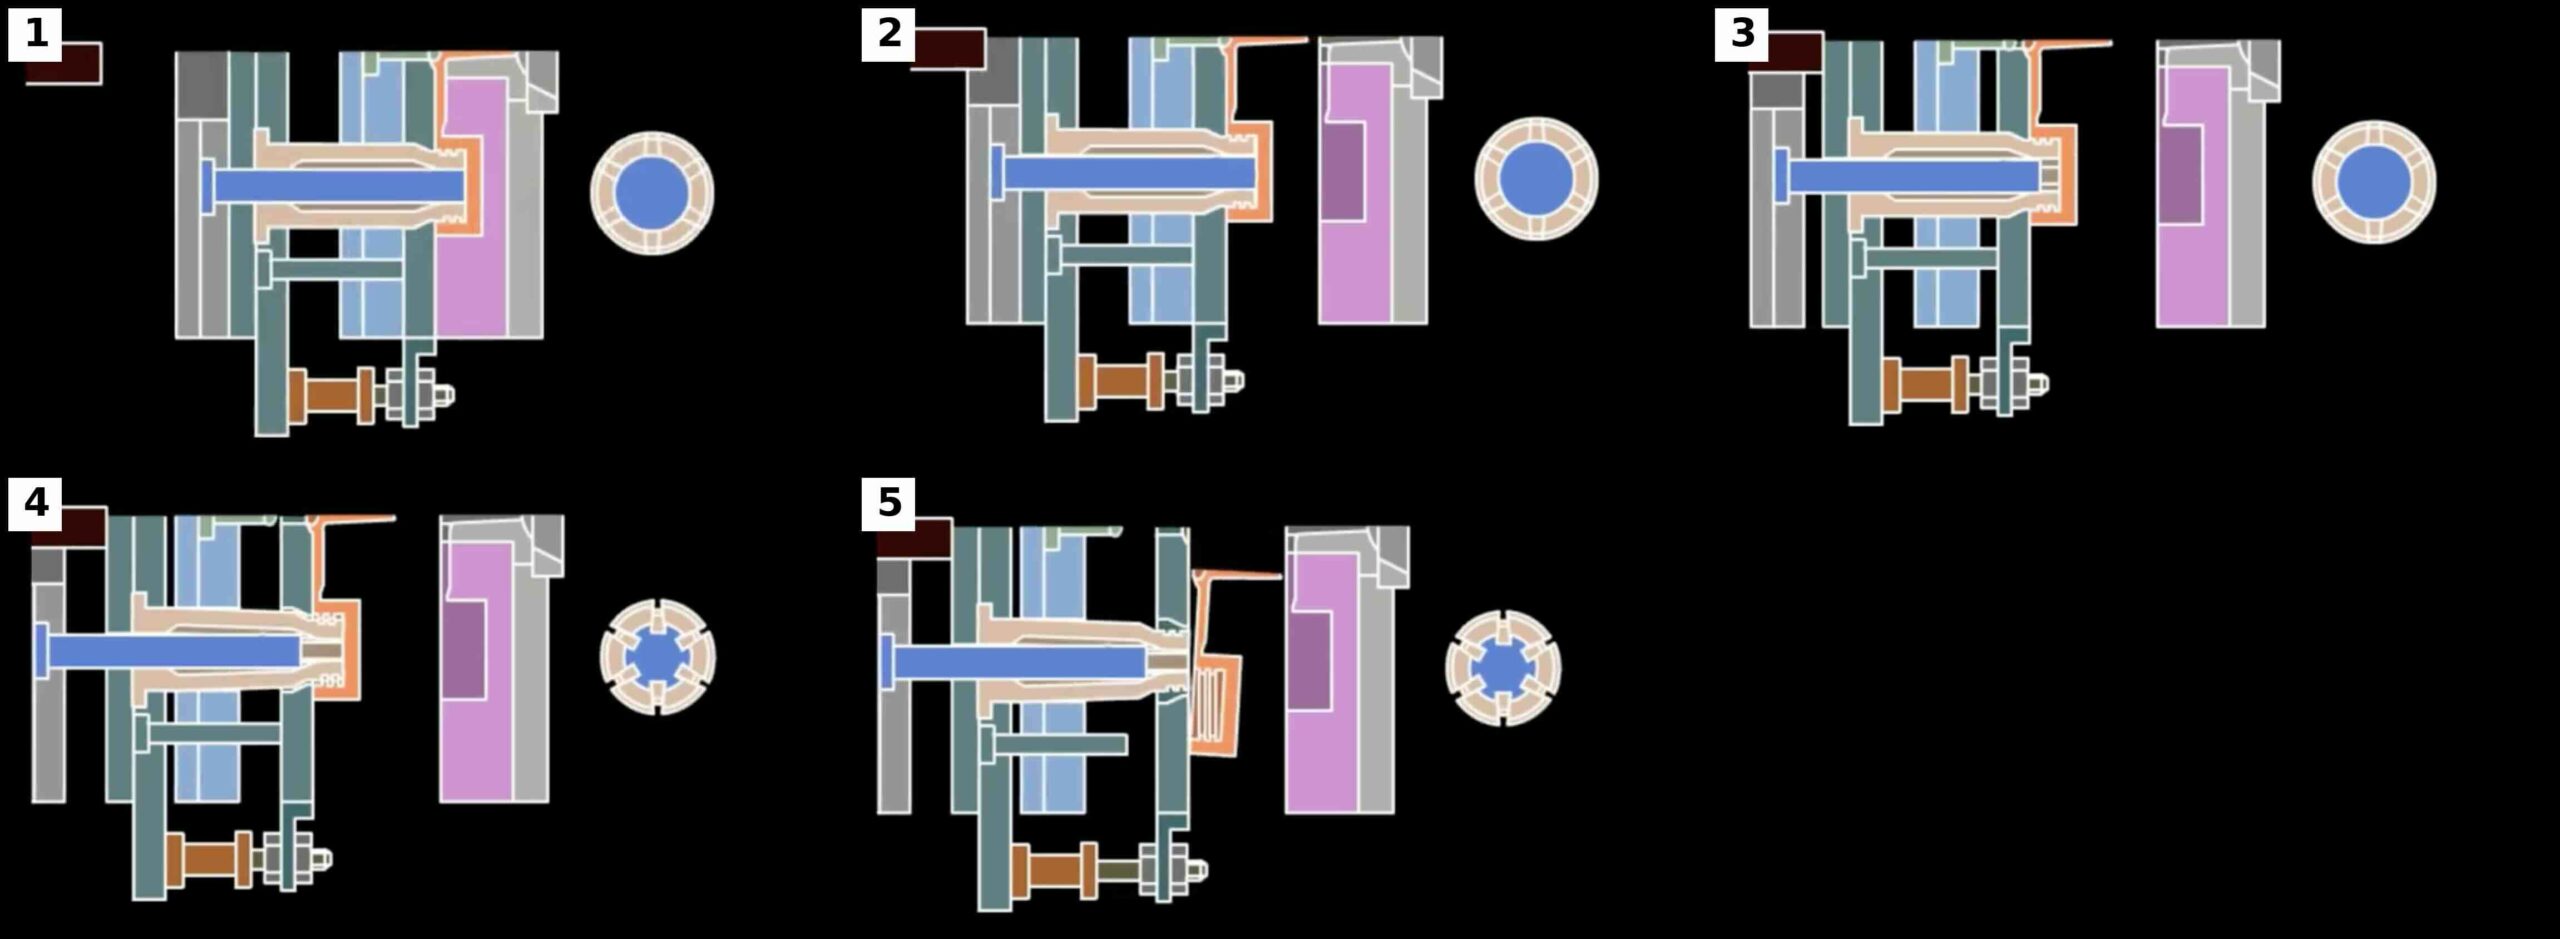
Mechanism 3
Hydraulic Continuous Internal Thread Unscrewing
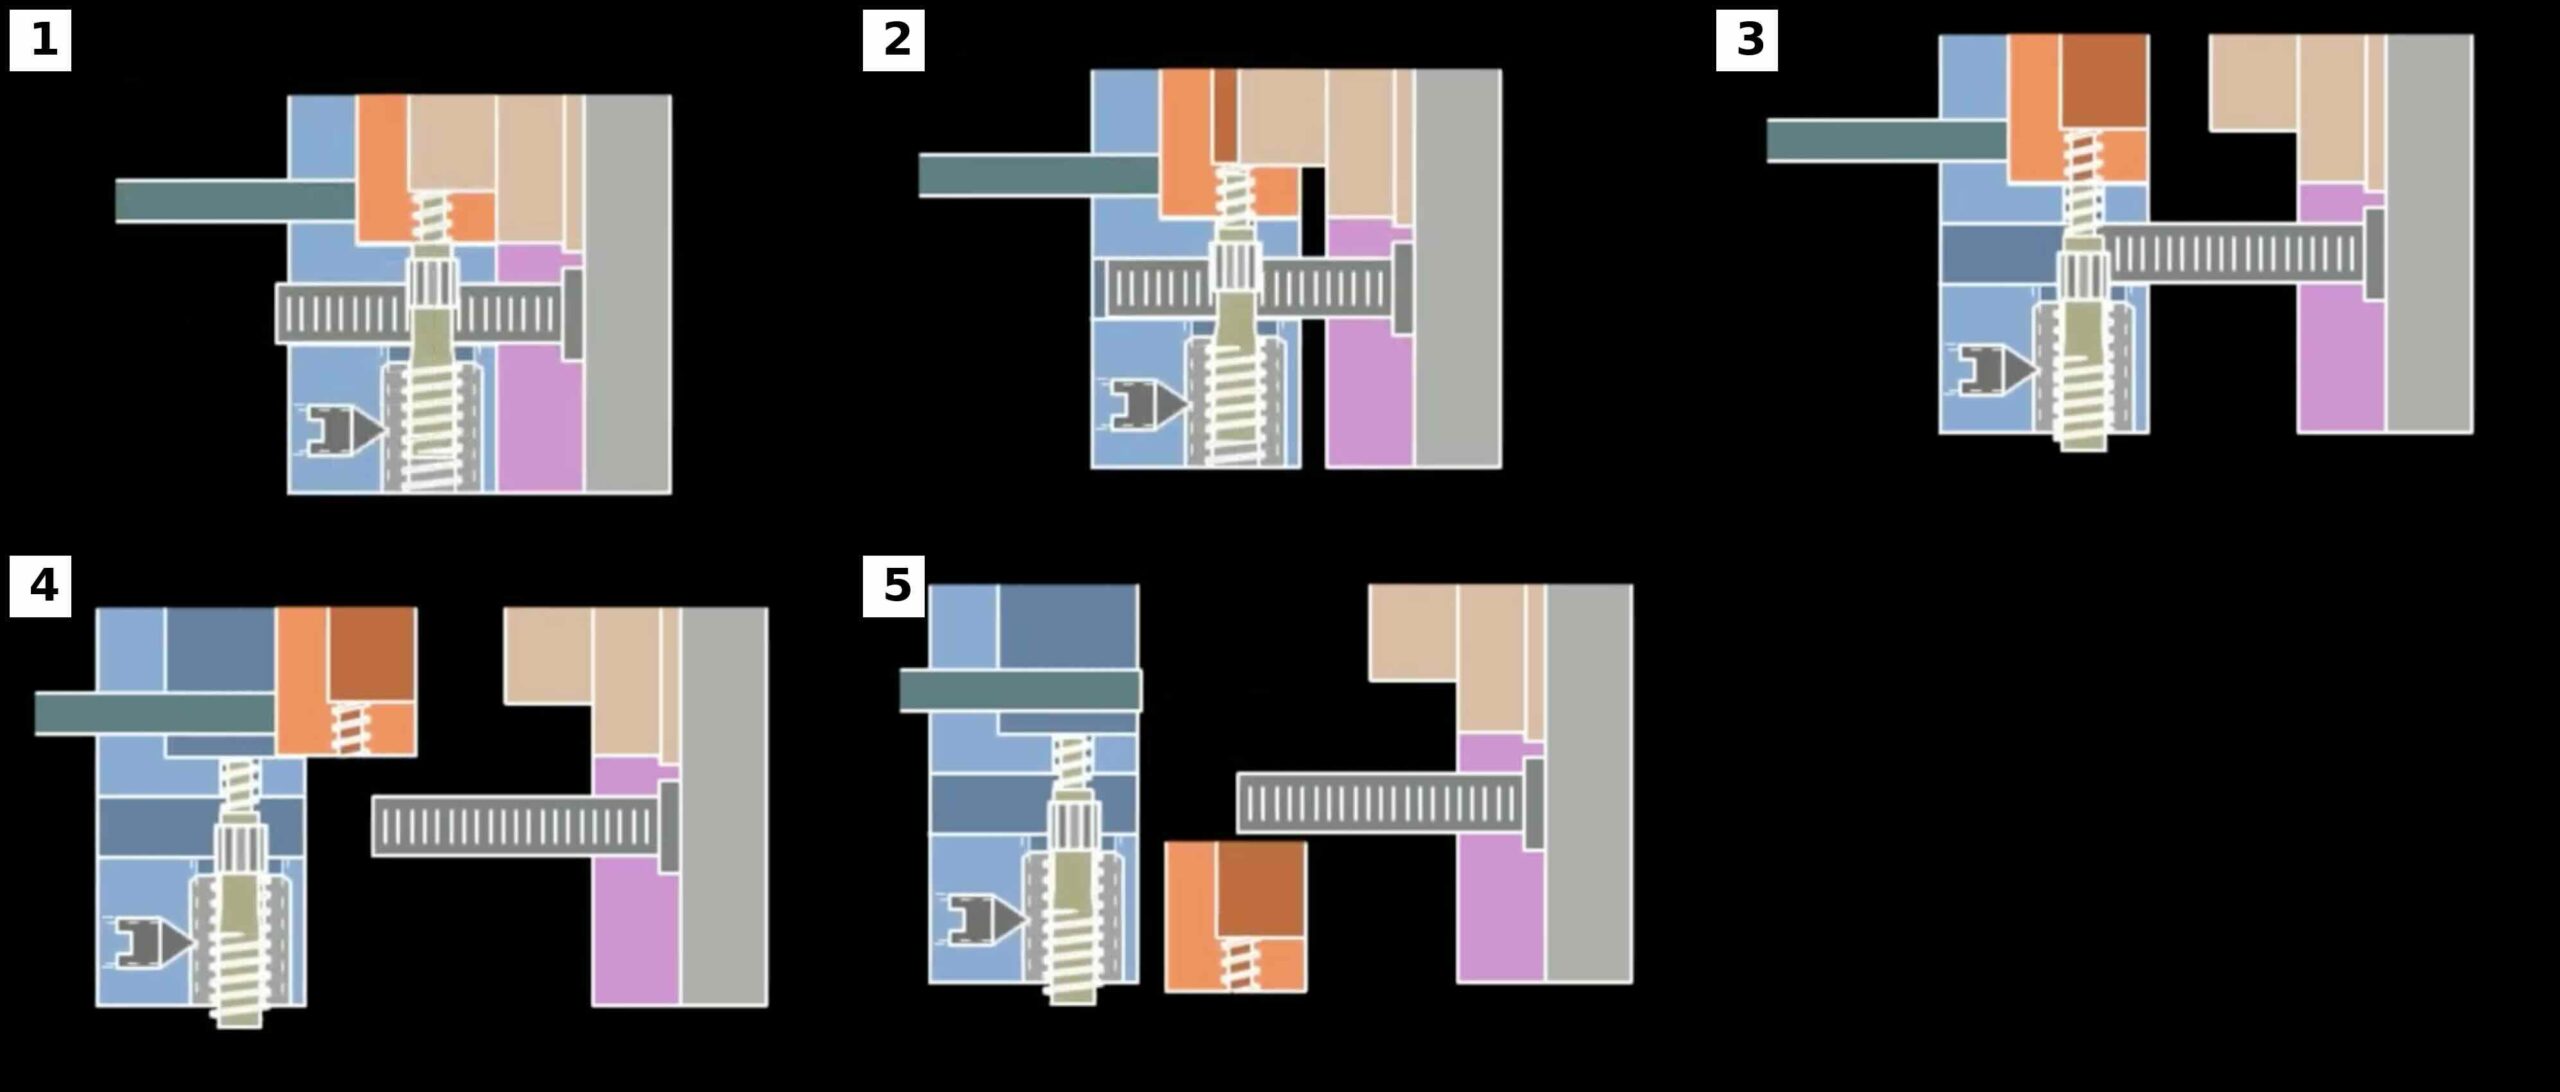
Mechanism 4
Force Stripping Thread System
Mechanism 5
Rack and Pinion Unscrewing Type 2
Mechanism 6
Machine Driven Unscrewing System
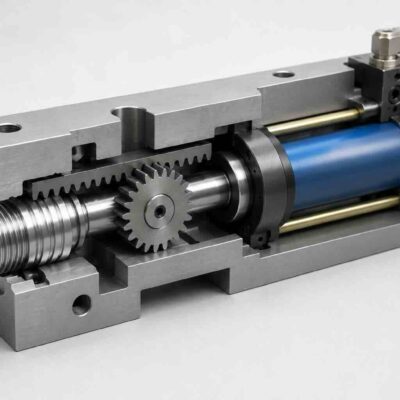
Mechanism 7
Hydraulic Cylinder Driven Unscrewing
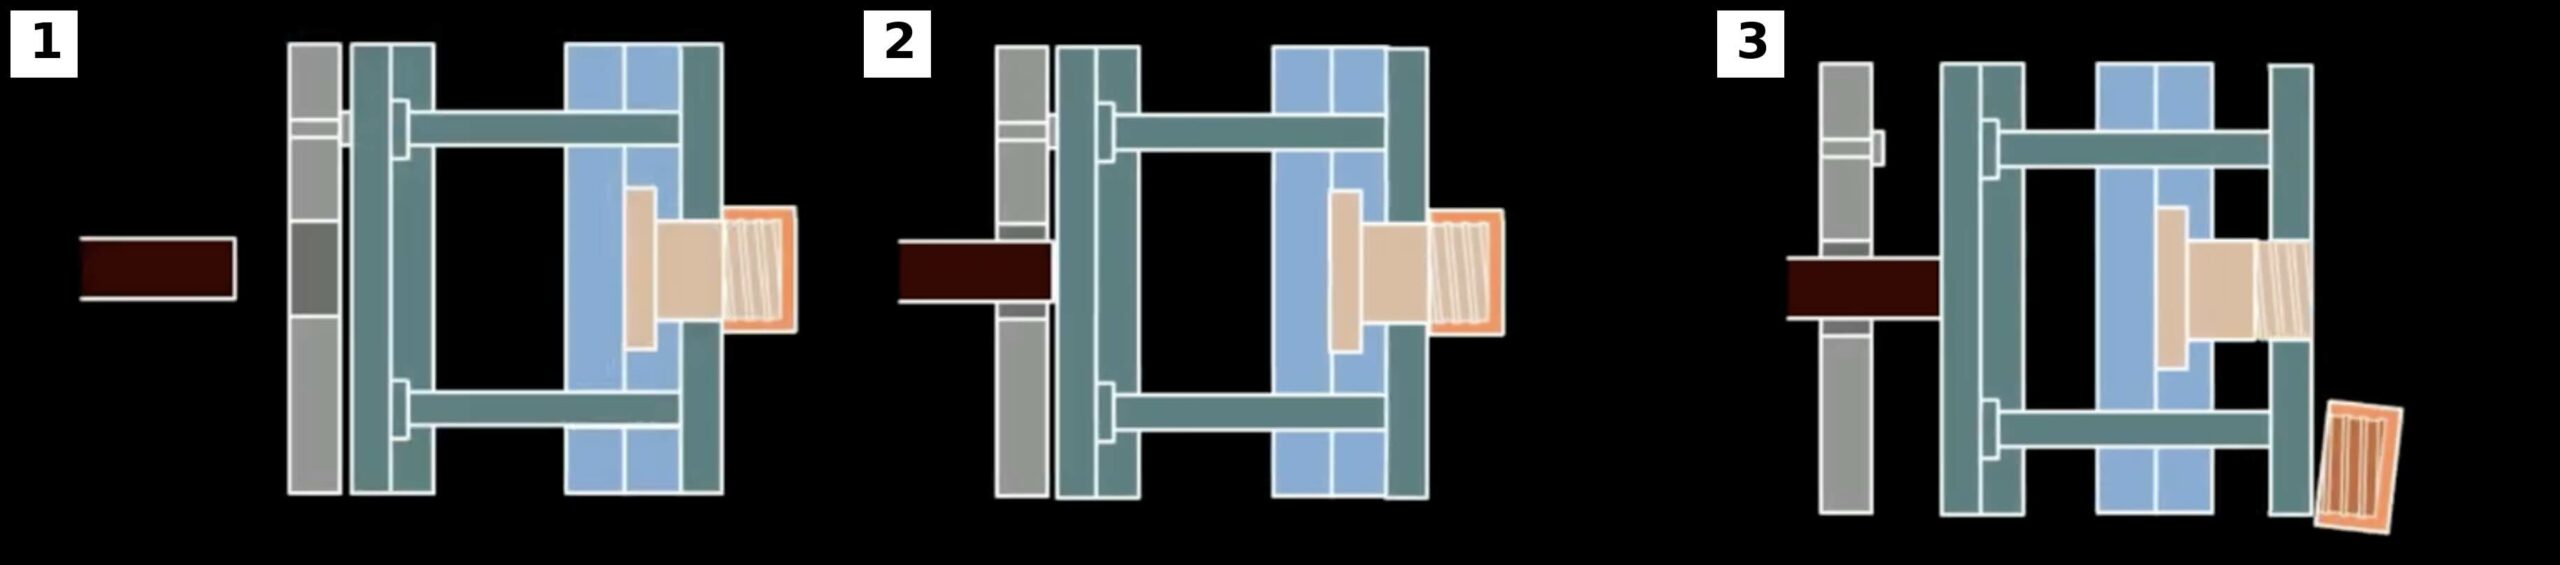
Mechanism 8
Manual Unscrewing Type 1
Mechanism 9
Manual Unscrewing Type 2
Mechanism 10
Manual Unscrewing Type 3
Why Mechanism Selection Is Critical
Selecting the wrong thread release system can create:
- Excessive tooling costs
- Long cycle times
- Reliability problems
- Difficult maintenance
- Production limitations
A properly selected mechanism can save hundreds of thousands of euros over the life of a mold.
The Five Primary Selection Factors
Experienced mold designers typically evaluate five major factors.
Factor 1
Thread Geometry
Factor 2
Material Properties
Factor 3
Production Volume
Factor 4
Automation Requirements
Factor 5
Economic Justification
These factors drive most engineering decisions.
Factor 1 – Thread Geometry
Thread geometry is usually the most important factor.
The engineer must evaluate:
- Diameter
- Pitch
- Depth
- Engagement length
- Internal or external thread
Thread Diameter Classification
For selection purposes:
Small Threads
Less Than 25 mm
Medium Threads
25 to 60 mm
Large Threads
Greater Than 60 mm
As diameter increases:
- Unscrewing torque increases
- Mechanism complexity increases
- Force stripping becomes less practical
Thread Engagement Classification
Short Engagement
Less Than 5 mm
Medium Engagement
5 to 15 mm
Long Engagement
Greater Than 15 mm
Long engagement lengths generally favor:
- Mechanical unscrewing
- Hydraulic unscrewing
rather than force stripping.
Internal Versus External Threads
This distinction is critical.
External Threads
Generally easier to release.
Suitable for:
- Force stripping
- Mechanical systems
- Manual systems
Internal Threads
More difficult.
Often require:
- Hydraulic systems
- Collapsible systems
- Advanced unscrewing mechanisms
Factor 2 – Material Properties
Material selection strongly influences mechanism choice.
High Flexibility Materials
Examples:
- PP
- LDPE
- HDPE
Advantages:
- Suitable for force stripping
- Lower release forces
Medium Flexibility Materials
Examples:
- Nylon
- ABS
- Acetal
Typically require detailed analysis.
Low Flexibility Materials
Examples:
- PC
- PMMA
- Glass Filled Materials
Often require unscrewing systems.
Material Selection Matrix
| Material | Force Stripping | Mechanical | Hydraulic |
|---|---|---|---|
| PP | Excellent | Good | Good |
| HDPE | Excellent | Good | Good |
| Nylon | Moderate | Excellent | Excellent |
| PC | Poor | Excellent | Excellent |
| Glass Filled Nylon | Poor | Excellent | Excellent |
This matrix immediately narrows the design options.
Factor 3 – Production Volume
Production volume often determines economic feasibility.
Very Low Volume
Less Than 10,000 Parts Per Year
Preferred Mechanisms:
- 8
- 9
- 10
Manual systems often provide the lowest cost.
Low Volume
10,000 to 50,000 Parts Per Year
Preferred Mechanisms:
- 8
- 9
- 10
- 2
Medium Volume
50,000 to 250,000 Parts Per Year
Preferred Mechanisms:
- 1
- 2
- 5
- 6
High Volume
Greater Than 250,000 Parts Per Year
Preferred Mechanisms:
- 1
- 2
- 5
- 7
Very High Volume
Millions of Parts Per Year
Preferred Mechanism:
4
Force Stripping
when technically feasible.
Why Production Volume Matters
Consider two molds.
Manual Mold
Cost
€15,000
Automatic Mold
Cost
€50,000
If production requires:
5,000 Parts
manual operation is usually justified.
If production requires:
50 Million Parts
automation becomes essential.
Factor 4 – Automation Requirements
Automation requirements strongly influence mechanism selection.
Fully Automated Production
Suitable Mechanisms
1
2
3
5
6
7
Semi-Automatic Production
Suitable Mechanisms
8
9
10
Lights-Out Manufacturing
Suitable Mechanisms
1
2
5
7
Manual systems are generally unsuitable for lights-out manufacturing.
Factor 5 – Economic Justification
The most technically advanced solution is not always the best solution.
Many engineers mistakenly select the most sophisticated mechanism available.
Experienced designers focus on economics.
Total Ownership Cost
Formula
Total Cost =
Tool Cost
Maintenance Cost
Labor Cost
Downtime Cost
Replacement Cost
The best mechanism is often the one with the lowest total ownership cost.
Not necessarily the lowest tooling cost.
Preliminary Selection Flowchart
Step 1
Can the thread be force stripped?
If YES
Evaluate Mechanism 4
If NO
Continue
Step 2
Is production volume low?
If YES
Evaluate Mechanisms 8, 9 or 10
If NO
Continue
Step 3
Is high torque required?
If YES
Evaluate Mechanisms 3 or 7
If NO
Continue
Step 4
Is fully automatic operation required?
If YES
Evaluate Mechanisms 1, 2, 5 or 6
This process quickly narrows the selection.
First Engineering Example
Product
Beverage Closure
Material
PP
Thread Diameter
38 mm
Production
120 Million Parts Per Year
Evaluation
Flexible Material
Yes
High Volume
Yes
Result
Mechanism 4
Force Stripping
Clearly Preferred
Second Engineering Example
Product
Industrial Connector
Material
Glass Filled Nylon
Thread Diameter
60 mm
Production
1 Million Parts Per Year
Evaluation
Flexible Material
No
High Torque
Yes
Result
Mechanism 7
Hydraulic Unscrewing
Preferred
Design Checklist
Before selecting a thread release system verify:
□ Thread geometry reviewed
□ Material evaluated
□ Production volume established
□ Automation requirements defined
□ Cost targets established
□ Maintenance requirements reviewed
□ Reliability requirements defined
Part 2 – Performance Comparison, Scoring Systems and Quantitative Selection
In Part 1, we established the fundamental selection methodology for all ten thread release mechanisms.
We examined:
- Thread geometry
- Material properties
- Production volume
- Automation requirements
- Economic justification
These factors narrow the possible solutions.
However, professional mold designers rarely stop there.
Once several candidate mechanisms remain, a more objective comparison becomes necessary.
This chapter introduces engineering scoring methods that allow designers to compare thread release mechanisms quantitatively.
The goal is to replace subjective opinions with measurable engineering criteria.
Why Selection Mistakes Occur
Many molds are designed based on:
- Personal preference
- Previous experience
- Customer assumptions
- Historical company standards
These approaches often ignore better alternatives.
The best mechanism should be selected through engineering analysis rather than habit.
The Six Performance Categories
For most threaded molding applications, six categories determine overall performance.
Category 1
Tooling Cost
Category 2
Cycle Time
Category 3
Reliability
Category 4
Maintenance Requirements
Category 5
Automation Capability
Category 6
Technical Capability
Together, these categories create a complete evaluation system.
Tooling Cost Comparison
Initial tooling cost remains one of the most important selection criteria.
Relative Tooling Cost Ranking
Mechanism 10
Lowest Cost
Mechanism 9
Very Low Cost
Mechanism 8
Low Cost
Mechanism 4
Low Cost
Mechanisms 2 and 5
Medium Cost
Mechanisms 1 and 6
High Cost
Mechanisms 3 and 7
Very High Cost
Tooling Cost Score
| Mechanism | Cost Score |
|---|---|
| 10 | 10 |
| 9 | 9 |
| 8 | 8 |
| 4 | 8 |
| 2 | 6 |
| 5 | 6 |
| 1 | 4 |
| 6 | 4 |
| 3 | 2 |
| 7 | 2 |
Higher score means lower tooling cost.
Cycle Time Comparison
Cycle time directly affects productivity.
Fastest Systems
Mechanism 4
Force Stripping
No unscrewing motion required.
Medium Speed Systems
Mechanisms
1
2
5
6
7
Slow Systems
Mechanisms
8
9
10
Manual operation required.
Cycle Time Score
| Mechanism | Cycle Time Score |
| 4 | 10 |
| 1 | 8 |
| 2 | 8 |
| 5 | 8 |
| 6 | 8 |
| 7 | 7 |
| 3 | 6 |
| 8 | 4 |
| 9 | 3 |
| 10 | 2 |
Reliability Comparison
Reliability measures the probability of operating without failure.
Most Reliable Systems
Mechanism 4
Very few moving components.
Mechanisms 9 and 10
Extremely simple.
Moderate Reliability
Mechanisms
2
5
8
Lower Reliability
Mechanisms
1
3
6
7
Additional components increase failure opportunities.
Reliability Score
| Mechanism | Reliability Score |
| 4 | 10 |
| 9 | 9 |
| 10 | 9 |
| 8 | 8 |
| 2 | 8 |
| 5 | 8 |
| 1 | 7 |
| 6 | 7 |
| 3 | 6 |
| 7 | 6 |
Maintenance Comparison
Maintenance affects operating cost.
Lowest Maintenance
Mechanisms
4
9
10
Medium Maintenance
Mechanisms
2
5
8
Highest Maintenance
Mechanisms
1
3
6
7
Maintenance Score
| Mechanism | Maintenance Score |
| 4 | 10 |
| 9 | 9 |
| 10 | 9 |
| 8 | 8 |
| 2 | 8 |
| 5 | 8 |
| 1 | 6 |
| 6 | 6 |
| 3 | 5 |
| 7 | 5 |
Automation Capability
Automation is increasingly important in modern manufacturing.
Fully Automated Systems
Mechanisms
1
2
3
5
6
7
Semi-Automatic Systems
Mechanisms
8
9
10
Automation Score
| Mechanism | Automation Score |
| 1 | 10 |
| 2 | 10 |
| 3 | 10 |
| 5 | 10 |
| 6 | 10 |
| 7 | 10 |
| 8 | 3 |
| 9 | 2 |
| 10 | 1 |
| 4 | 10 |
Technical Capability
Technical capability measures the range of thread geometries that can be handled.
Highest Capability
Mechanisms
3
7
Hydraulic systems can handle very demanding applications.
Very Good Capability
Mechanisms
1
2
5
6
Limited Capability
Mechanisms
4
8
9
10
Technical Capability Score
| Mechanism | Capability Score |
| 3 | 10 |
| 7 | 10 |
| 1 | 9 |
| 2 | 9 |
| 5 | 9 |
| 6 | 9 |
| 4 | 6 |
| 8 | 5 |
| 9 | 4 |
| 10 | 3 |
Weighted Scoring System
Not every project has identical priorities.
A packaging mold may prioritize:
- Cycle time
- Cost
An automotive mold may prioritize:
- Reliability
- Automation
Weighted scoring solves this problem.
Example Weighting
Packaging Closure Mold
Tooling Cost
20%
Cycle Time
35%
Reliability
20%
Maintenance
10%
Automation
10%
Technical Capability
5%
Total
100%
Example Evaluation
Mechanism 4
Force Stripping
Tooling Cost
8 × 20%
=
1.6
Cycle Time
10 × 35%
=
3.5
Reliability
10 × 20%
=
2.0
Maintenance
10 × 10%
=
1.0
Automation
10 × 10%
=
1.0
Capability
6 × 5%
=
0.3
Total Score
9.4
Result
Mechanism 4 becomes the preferred solution.
Automotive Example
Product
Automotive Reservoir Cap
Material
Glass Filled Nylon
Thread Diameter
60 mm
Production
2 Million Parts Per Year
Key Requirements
Reliability
Very High
Automation
Very High
Capability
Very High
Weighted Results
Mechanism 7 typically achieves the highest score.
Hydraulic Unscrewing becomes the preferred solution.
Medical Device Example
Product
Medical Fluid Connector
Internal Thread
High Precision
Medium Production
Evaluation
Force Stripping
Not Suitable
Manual Systems
Not Suitable
Mechanical Systems
Possible
Hydraulic Systems
Preferred
Mechanism 3 often becomes the highest-ranked solution.
Scoring Matrix for All Ten Mechanisms
| Mechanism | Cost | Speed | Reliability | Maintenance | Automation | Capability |
| 1 | 4 | 8 | 7 | 6 | 10 | 9 |
| 2 | 6 | 8 | 8 | 8 | 10 | 9 |
| 3 | 2 | 6 | 6 | 5 | 10 | 10 |
| 4 | 8 | 10 | 10 | 10 | 10 | 6 |
| 5 | 6 | 8 | 8 | 8 | 10 | 9 |
| 6 | 4 | 8 | 7 | 6 | 10 | 9 |
| 7 | 2 | 7 | 6 | 5 | 10 | 10 |
| 8 | 8 | 4 | 8 | 8 | 3 | 5 |
| 9 | 9 | 3 | 9 | 9 | 2 | 4 |
| 10 | 10 | 2 | 9 | 9 | 1 | 3 |
This table provides a quick comparison between all ten systems.
Why There Is No Universal Winner
Many engineers ask:
“What is the best unscrewing mechanism?”
The answer is:
There is no universal winner.
Every mechanism represents a compromise between:
- Cost
- Speed
- Reliability
- Complexity
- Capability
The correct choice depends entirely on the application.
Engineering Selection Checklist
Before selecting a mechanism verify:
□ Thread geometry reviewed
□ Material reviewed
□ Production volume defined
□ Automation requirements defined
□ Cost targets established
□ Maintenance strategy established
□ Reliability targets established
□ Weighted scoring completed
Part 3 – ROI Analysis, Life-Cycle Cost Engineering and Production Economics
In Part 1, we established the engineering methodology for selecting thread release systems.
In Part 2, we introduced quantitative scoring systems to compare all ten mechanisms objectively.
The next step is often overlooked by mold designers:
Economic engineering.
A mechanism may be technically perfect yet economically unjustified.
Likewise, a simpler mechanism may generate significantly higher profits despite offering lower technical performance.
Experienced mold engineers evaluate:
- Return on investment (ROI)
- Life-cycle costs
- Production costs
- Labor costs
- Maintenance costs
- Downtime costs
- Productivity gains
before selecting the final solution.
This chapter focuses on the financial calculations behind thread release system selection.
Why Economics Matter
Many engineers focus only on technical performance.
Customers usually focus on profitability.
The best thread release system is rarely the most advanced system.
The best system is often the one that delivers:
Maximum profit
over the life of the mold.
Understanding Life-Cycle Cost
Life-cycle cost includes every cost generated throughout the mold’s operating life.
Formula
Life-Cycle Cost =
Tooling Cost
Maintenance Cost
Labor Cost
Downtime Cost
Replacement Cost
Many designers only compare tooling cost.
This often leads to incorrect decisions.
Example
Two Possible Designs
Design A
Force Stripping
Tool Cost
€120,000
Design B
Hydraulic Unscrewing
Tool Cost
€200,000
Initial Comparison
Force Stripping Appears Better
However:
Further analysis is required.
Maintenance Cost Evaluation
Maintenance costs accumulate throughout mold life.
Typical Relative Maintenance Ranking
Mechanism 4
Very Low
Mechanisms 9 and 10
Low
Mechanisms 2, 5 and 8
Moderate
Mechanisms 1 and 6
High
Mechanisms 3 and 7
Highest
Maintenance Example
Ten-Year Mold Life
Force Stripping
Maintenance
€15,000
Hydraulic System
Maintenance
€60,000
Difference
€45,000
This difference can significantly affect profitability.
Labor Cost Analysis
Labor is one of the largest hidden costs.
This is especially important for:
- Mechanism 8
- Mechanism 9
- Mechanism 10
Example
Manual Operation
Additional Cycle Time
10 Seconds
Production
100,000 Parts
Additional Labor Time
100,000 × 10
=
1,000,000 Seconds
Convert
1,000,000 / 3600
=
278 Hours
Labor Rate
€25 Per Hour
Additional Labor Cost
278 × 25
=
€6,950
This cost must be included in the evaluation.
Downtime Cost Analysis
Downtime is frequently underestimated.
Production interruptions often cost far more than maintenance.
Formula
Downtime Cost =
Hourly Production Value
×
Downtime Hours
Example
Production Value
€800 Per Hour
Unexpected Downtime
40 Hours
Calculation
800 × 40
=
€32,000
Result
Downtime Cost
€32,000
This is why reliability has economic value.
Understanding ROI
ROI measures the financial benefit of an investment.
Formula
ROI (%) =
(Net Gain / Investment)
×
100
Example
Automatic Unscrewing System
Additional Cost
€40,000
Annual Savings
€12,000
Five-Year Savings
€60,000
Net Gain
60,000 − 40,000
=
€20,000
ROI
(20,000 / 40,000)
×
100
=
50%
Result
Positive Investment
Payback Period
Payback period determines how long it takes to recover the investment.
Formula
Payback Period =
Investment
/
Annual Savings
Example
Investment
€40,000
Annual Savings
€12,000
Calculation
40,000 / 12,000
=
3.33 Years
Result
Payback Period
3.3 Years
Many companies require payback periods shorter than:
3 to 5 Years
before approving tooling upgrades.
Cycle Time Economics
Cycle time improvements often produce enormous savings.
Example
Current Cycle
20 Seconds
Improved Cycle
18 Seconds
Improvement
10 Percent
Annual Production
2 Million Parts
Machine Rate
€60 Per Hour
Annual Savings
Often exceeds tens of thousands of euros.
This is why Mechanism 4 dominates many packaging applications.
Production Capacity Calculation
Formula
Parts Per Hour =
3600
/
Cycle Time
Example
Cycle Time
20 Seconds
Calculation
3600 / 20
=
180 Parts Per Hour
Result
Production Rate
180 Parts Per Hour Per Cavity
Capacity Comparison
20 Second Cycle
180 Parts Per Hour
18 Second Cycle
200 Parts Per Hour
Improvement
11 Percent
Over millions of parts, this difference becomes significant.
Economic Impact of Reliability
Reliability directly affects profitability.
Reliable systems generate:
- Less downtime
- Lower maintenance
- More production
Example
System A
Availability
95 Percent
System B
Availability
99 Percent
Annual Production Hours
6000
Additional Operating Hours
6000 × (0.99 − 0.95)
=
240 Hours
If production value is:
€500 Per Hour
Additional Annual Value
240 × 500
=
€120,000
Reliability has measurable financial value.
Economic Comparison of All Ten Mechanisms
Lowest Cost Applications
Preferred Systems
9
10
8
Lowest Maintenance Applications
Preferred Systems
4
9
10
Highest Productivity Applications
Preferred Systems
4
1
2
5
Highest Capability Applications
Preferred Systems
3
7
Best Balance Applications
Preferred Systems
2
5
These systems often provide the best compromise between:
- Cost
- Reliability
- Capability
Example Selection Study
Product
Beverage Cap
Material
PP
Production
100 Million Parts Per Year
Evaluation
Force Stripping Possible
Yes
Economic Result
Mechanism 4
Clearly Superior
Reason
Even small cycle-time improvements generate massive savings.
Example Selection Study
Product
Industrial Electrical Connector
Material
Glass Filled Nylon
Production
50,000 Parts Per Year
Evaluation
Force Stripping
Not Possible
Automatic Operation
Not Required
Economic Result
Mechanism 8
Preferred
Reason
Lowest ownership cost.
Example Selection Study
Product
Automotive Reservoir
Material
Glass Filled PA66
Production
3 Million Parts Per Year
Internal Thread
Yes
Required Torque
High
Economic Result
Mechanism 7
Preferred
Reason
Technical capability outweighs additional cost.
Capital Investment Matrix
| Production Volume | Recommended Investment Level |
|---|---|
| <10,000 Parts | Minimal |
| 10,000–50,000 Parts | Low |
| 50,000–250,000 Parts | Moderate |
| 250,000–1 Million Parts | High |
| >1 Million Parts | Maximum Optimization |
As production volume increases, more sophisticated systems become economically justified.
Common Economic Mistakes
Mistake 1
Comparing only tooling cost.
Mistake 2
Ignoring labor costs.
Mistake 3
Ignoring downtime.
Mistake 4
Ignoring cycle-time savings.
Mistake 5
Ignoring maintenance costs.
Mistake 6
Ignoring mold life.
Economic Evaluation Checklist
Before selecting a mechanism verify:
□ Tool cost calculated
□ Maintenance cost estimated
□ Labor cost estimated
□ Downtime cost estimated
□ Production volume verified
□ ROI calculated
□ Payback period calculated
□ Life-cycle cost calculated
□ Reliability value considered
□ Productivity value considered
Part 4 – Future Technologies, Final Decision Matrix and Complete Engineering Workflow
This chapter concludes the entire six-pillar engineering series covering threaded injection mold release systems.
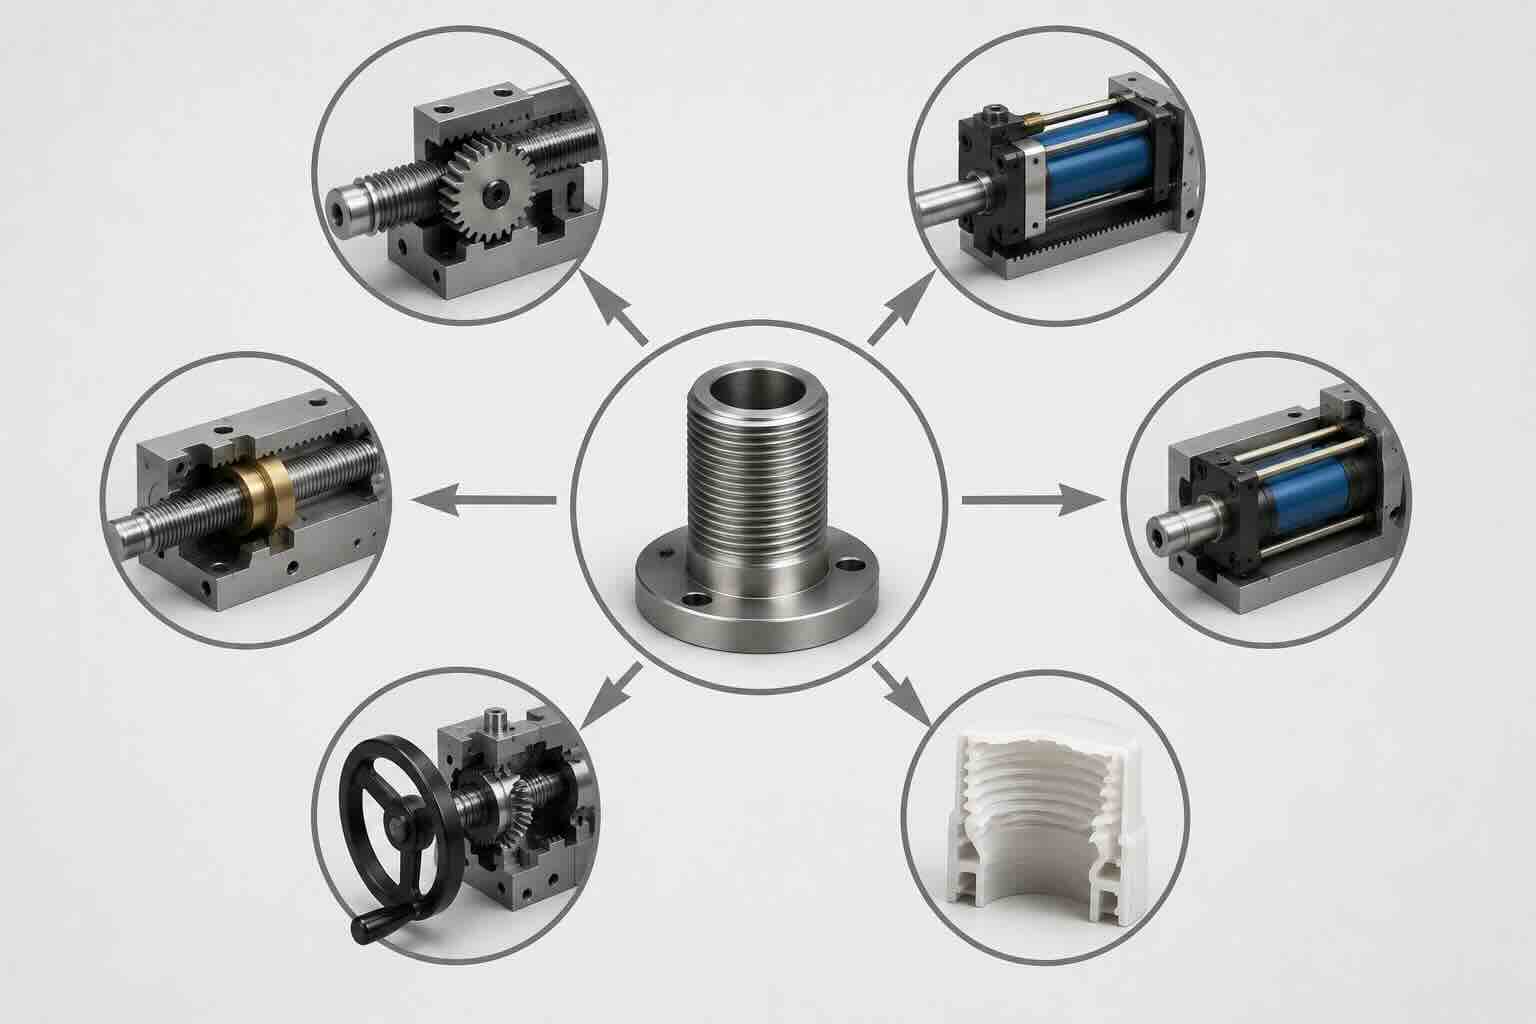
Throughout the series we analyzed all ten mechanisms:
- Mechanism 1 – Motor Driven Unscrewing
- Mechanism 2 – Rack and Pinion Unscrewing Type 1
- Mechanism 3 – Hydraulic Continuous Internal Unscrewing
- Mechanism 4 – Force Stripping
- Mechanism 5 – Rack and Pinion Unscrewing Type 2
- Mechanism 6 – Machine Driven Unscrewing
- Mechanism 7 – Hydraulic Cylinder Driven Unscrewing
- Mechanism 8 – Manual Unscrewing Type 1
- Mechanism 9 – Manual Unscrewing Type 2
- Mechanism 10 – Manual Unscrewing Type 3
We explored:
- Thread geometry
- Material behavior
- Force calculations
- Torque calculations
- Reliability engineering
- Economic evaluation
- Life-cycle cost analysis
The final step is transforming these concepts into a complete engineering decision process that can be used on real-world mold projects.
The Reality of Modern Mold Design
The most successful mold designers do not ask:
“What mechanism do I like?”
Instead they ask:
“What mechanism delivers the best balance of performance, reliability and profitability?”
The answer changes from project to project.
There is no universal solution.
Every threaded molding application represents a unique engineering problem.
The Complete Decision Matrix
The following matrix summarizes the strengths of all ten mechanisms.
| Mechanism | Cost | Speed | Reliability | Automation | Capability |
|---|---|---|---|---|---|
| 1 | Medium | High | Good | Excellent | Excellent |
| 2 | Medium | High | Very Good | Excellent | Excellent |
| 3 | High | Medium | Good | Excellent | Outstanding |
| 4 | Low | Outstanding | Outstanding | Excellent | Moderate |
| 5 | Medium | High | Very Good | Excellent | Excellent |
| 6 | Medium | High | Good | Excellent | Excellent |
| 7 | High | High | Good | Excellent | Outstanding |
| 8 | Low | Moderate | Excellent | Limited | Moderate |
| 9 | Very Low | Low | Excellent | Limited | Limited |
| 10 | Lowest | Lowest | Excellent | Minimal | Limited |
This matrix can be used as the starting point for any selection process.
The Ultimate Engineering Rule
Before considering any unscrewing system, always ask:
Can the thread be force stripped?
Why Mechanism 4 Comes First
Force stripping offers:
- Lowest maintenance
- Highest reliability
- Fastest cycle time
- Lowest complexity
Whenever force stripping is technically feasible, it should always be evaluated first.
This rule alone can save enormous tooling costs.
Selection Workflow
Experienced mold designers often follow the following process.
Step 1
Evaluate Material
Flexible materials:
- PP
- LDPE
- HDPE
Immediately suggest force stripping analysis.
Step 2
Evaluate Thread Geometry
Review:
- Diameter
- Pitch
- Depth
- Engagement length
Determine whether force stripping remains possible.
Step 3
Determine Production Volume
This often eliminates many alternatives immediately.
Step 4
Determine Automation Requirements
Fully automatic?
Semi-automatic?
Manual?
Step 5
Estimate Unscrewing Torque
This determines whether:
- Mechanical systems
- Hydraulic systems
are required.
Step 6
Perform Economic Analysis
Calculate:
- ROI
- Payback period
- Life-cycle cost
Step 7
Select Mechanism
Only after all previous steps are complete.
Mechanism Selection by Production Volume
Less Than 10,000 Parts Per Year
Preferred Systems
9
10
8
Reason
Lowest investment.
10,000 to 50,000 Parts Per Year
Preferred Systems
8
9
10
2
Reason
Balanced economics.
50,000 to 500,000 Parts Per Year
Preferred Systems
2
5
1
6
Reason
Automation becomes valuable.
Greater Than 500,000 Parts Per Year
Preferred Systems
1
2
5
7
Reason
Productivity dominates.
Millions of Parts Per Year
Preferred System
4
when technically possible.
Mechanism Selection by Thread Type
External Threads
Best Candidates
4
1
2
5
Internal Threads
Best Candidates
3
7
1
2
Internal threads usually require more sophisticated release systems.
Mechanism Selection by Material
Polypropylene
Preferred
4
Force Stripping
Polyethylene
Preferred
4
Force Stripping
ABS
Preferred
1
2
5
Nylon
Preferred
2
5
7
Glass Filled Nylon
Preferred
7
3
Polycarbonate
Preferred
2
5
7
Advanced Selection Example 1
Product
Mineral Water Closure
Material
PP
Thread Diameter
28 mm
Production
500 Million Parts Per Year
Evaluation
Flexible Material
Yes
Force Stripping Possible
Yes
Result
Mechanism 4
Without question.
Advanced Selection Example 2
Product
Automotive Reservoir
Material
PA66 GF30
Thread Diameter
65 mm
Production
3 Million Parts Per Year
Evaluation
Glass Filled Material
Yes
High Torque
Yes
Internal Thread
Yes
Result
Mechanism 7
Hydraulic Unscrewing
Advanced Selection Example 3
Product
Industrial Electrical Connector
Material
ABS
Thread Diameter
40 mm
Production
20,000 Parts Per Year
Evaluation
Moderate Volume
Low Automation Requirement
Result
Mechanism 8
Manual Unscrewing
Most economical solution.
Emerging Technologies
The future of thread release systems is evolving rapidly.
Several technologies are becoming increasingly important.
Servo Driven Unscrewing Systems
Servo systems provide:
- Precise positioning
- Programmable speed
- Torque monitoring
Advantages
- Excellent control
- Industry 4.0 compatibility
Limitations
- Higher cost
Smart Mold Technology
Modern molds increasingly include:
- Sensors
- Load monitoring
- Position monitoring
Benefits
- Predictive maintenance
- Reduced downtime
Predictive Maintenance
Future molds will increasingly monitor:
- Torque trends
- Gear wear
- Bearing condition
- Hydraulic pressure
The goal is identifying failures before production stops.
Artificial Intelligence in Mold Design
AI-assisted design tools are beginning to assist engineers with:
- Mechanism selection
- Design optimization
- Cost prediction
- Maintenance forecasting
These tools will likely become common over the next decade.
Digital Twin Technology
A digital twin is a virtual model of a mold.
Engineers can simulate:
- Unscrewing forces
- Thread release
- Wear
- Maintenance schedules
before manufacturing the mold.
This can dramatically reduce development risk.
Sustainability Considerations
Future mold designs will increasingly prioritize:
- Energy efficiency
- Reduced maintenance
- Longer service life
Mechanisms with fewer moving components will become increasingly attractive.
Final Engineering Guidelines
After analyzing all ten mechanisms, several universal principles emerge.
Guideline 1
Always evaluate force stripping first.
Guideline 2
Use the simplest mechanism capable of meeting requirements.
Guideline 3
Avoid unnecessary automation.
Guideline 4
Evaluate total ownership cost.
Guideline 5
Design for maintenance.
Guideline 6
Consider mold life from the beginning.
Guideline 7
Optimize thread geometry before designing the mechanism.
Guideline 8
Base decisions on calculations rather than assumptions.
Master Selection Checklist
Before final mechanism approval verify:
□ Material evaluated
□ Thread geometry evaluated
□ Production volume established
□ Automation requirements defined
□ Unscrewing torque calculated
□ Reliability targets established
□ Maintenance strategy defined
□ ROI calculated
□ Life-cycle cost evaluated
□ Force stripping evaluated
□ Final scoring completed
□ Mechanism justified
Final Conclusion
Thread release systems represent one of the most challenging aspects of injection mold engineering.
Successful selection requires balancing:
- Technical performance
- Manufacturing efficiency
- Reliability
- Maintenance
- Economics
No single mechanism is universally superior.
The best solution is always the one that satisfies the technical requirements while delivering the lowest total ownership cost.
By applying the methodologies, calculations and engineering workflows presented throughout this six-article series, mold designers can confidently evaluate any threaded molding application and select the most effective release mechanism.
Whether the answer is a simple force stripping design, a manual unscrewing core, a mechanical rack-and-pinion system or a sophisticated hydraulic mechanism, the selection will be based on sound engineering principles rather than assumptions.